
Walking & Cycling
There are some routes through the area where people walk or cycle away from traffic, but because the main roads are often the most direct and easiest routes, avoiding the steepest hills, and because many important destinations are on these routes, it’s here that the majority of people walk and cycle and will continue to want to do so.
| Main Walking Routes | Main Cycling Routes |
Travel In The BBEST Area
- 74-76% of students travel to the University on foot as their “main mode of transport”. 4% travel by cycle.
- 24% of staff travel to the University on foot, and 8-9% by cycle.
- University Travel Surveys, 2010 and 2012
- For students the average distance per person per day on return trips is 2.5 miles for walking and 4.3 miles for cycling.
- For staff the average distance per person per day on return trips is 8 miles for cycling.
- University Travel Survey 2012
- In Sheffield as a whole, for return journeys to work between 4 and 10 km in length (2.5-6.2 miles), walking (9.3% of all work journeys) is preferred to cycling (3.2% of total).
- Office for National Statistics: 2011 Census Analysis – Cycling to Work
- Just 1% of all vehicular traffic on the main route through the corridor is pedal cycles.
- Census points on Whitham Road and Fulwood Road, 2000-2012
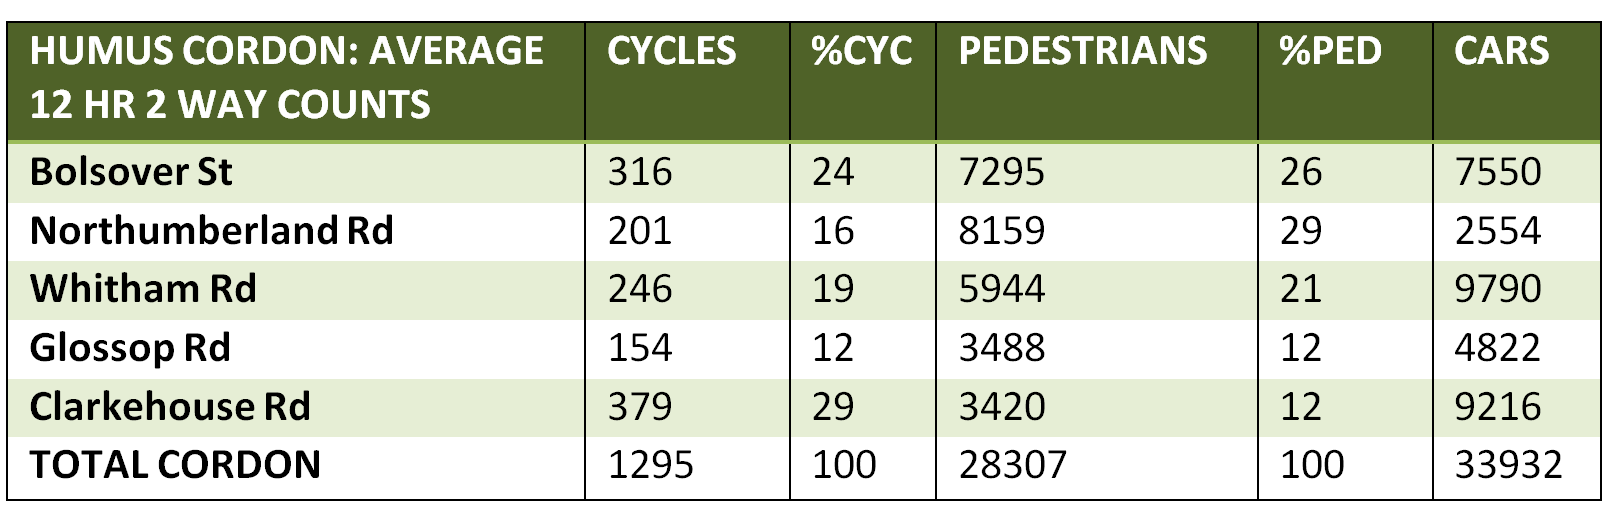
- Pedestrian volumes in the BBEST corridor are of a similar order of magnitude to car volumes.
- Sheffield City Council Annual Cordon Counts 2005-2014, Hospitals/University/Museums 5 point survey (Table below)
 Air Quality
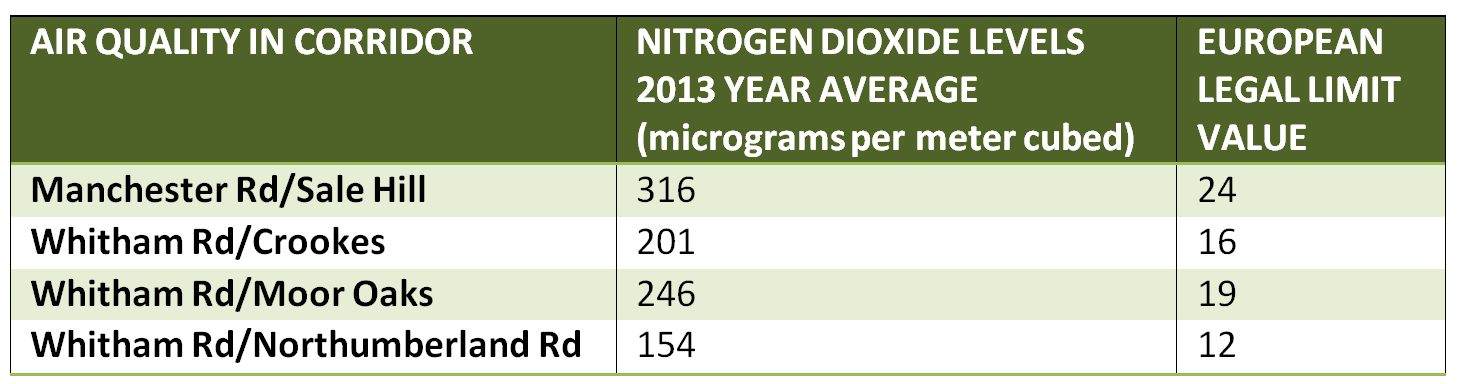
Sheffield City Council Monitoring of Nitrogen Dioxide 2013